{Gene Set Clustering based on Functional annotation} |
GeneSCF v1.1 complete user manual (Download) and follow discussions on Biostars
GeneSCF does not need any complex installation procedures.
1.1) Installation
☞ Download the tool
☞ Extract it in your directory (use, tar -zxvf geneSCF-master-vx.x.tar.gz)
☞ Use it from the extracted folder. See GeneSCF usage. ☟
1.2) Basic Requirements
☞ Check whether perl is in the user executable path (If not use it as temporary path, export PATH=$PATH:/path/to/perl_dir)
☞ Test the following UNIX commands on your system before proceeding for analysis: awk, cat, unzip, gzip, wget, rm, mkdir, sort, date, sed, paste, join, grep, curl, echo
☞ If needed graphical output, pre installation of R version > 3.0 and 'ggplot2' R package is required
1.3) System requirements
☞ GeneSCF only works on Linux system, it has been successfully tested on Ubuntu, Mint and Cent OS. Other distributions of Linux might work as well.
GeneSCF performs enrichment or gene set clustering in two modes using following command. All parameters are required to be specified to run GeneSCF successfully. Run test dataset for tutorial under Section 4.☟
| ./geneSCF -m=[update|normal] -i=[INPUT FILE] -t=[gid|sym] -o=[OUTPUT PATH/FOLDER/] -db=[GO_all|GO_BP|GO_MF|GO_CC|KEGG|REACTOME] -p=[yes|no] -bg=[#TotalGenes] -org=[see,org_codes_help] |
| Parameters | Options | |||||
|---|---|---|---|---|---|---|
| [-m= | --mode=] | For normal mode use 'normal' and for update mode use 'update' without quotes. | |||||
| [-i= | --infile=] | Input file contains list of Entrez GeneIDs or OFFICIAL GENE SYMBOLS.The genes must be new lines seperated (One gene per line). | |||||
| [-t= | --gtype=] | Type of input in the provided list either Entrez GeneIDs 'gid' or OFFICIAL GENE SYMBOLS 'sym' (Without quotes, default: gid). | |||||
| [-db= | --database=] | Database to use as a source for finding gene enrichment, the options are either geneontology 'GO_all' or geneontology-biological_process 'GO_BP' or geneontology-molecular_function 'GO_MF' or geneontology-cellular_components 'GO_CC' or kegg 'KEGG' or reactome 'REACTOME' or Network of Cancer Genes 'NCG' (Without quotes). | |||||
| [-o= | --outpath=] | Existing directory to save output file (Don't forget to use trailing slash at end of the directory name). The output will be saved in the provided location as {INPUT_FILE_NAME}_{database}_functional_classification.tsv (tab-seperated file). Note: the specified folder should exist because GeneSCF does not create any output folder. | |||||
| [-bg= | --background=] | Total background genes to consider (Example : ~20,000 for human). | |||||
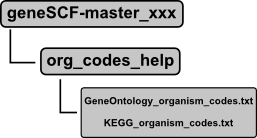
| [-org= | --organism=] | Please see organism codes(For human in KEGG ->'hsa' in Geneontology -> 'goa_human'). | |||||
| [-p= | --plot=] | For additional graphical output use 'yes' or 'no'.This requires R version > 3.0 and 'ggplot2' R package to be pre-installed on the system. | |||||
| [-h | --help] | For displaying this help page. |
The 'normal' mode from GeneSCF runs on already available databases on GeneSCF. To update existing database or to download new database to GeneSCF use 'prepare_database' module from GeneSCF.
| ./prepare_database -db=[GO_all|GO_BP|GO_MF|GO_CC|KEGG|REACTOME|NCG] -org=[see,org_codes_help] |
| Multi-organism supported database | Link for organism codes |
|---|---|
| KEGG | Link - second column from the link OR refer org_codes_help folder in the tool (Example for human, hsa) |
| GO | Link - "id" from the link OR refer org_codes_help folder in the tool (Example for human, goa_human) |
| Human supported database | codes |
| REACTOME | Hs |
| NCG | Hs |
Test datasets are included with GeneSCF download. You can find it in directory 'geneSCF-master-vx.x/test/'
Study 1: p53 bound genes from human in HCT116 cell line treated with DNA-damage-inducing drug in two different time points, 0 and 12 hours (ChIP dataset).
Geneontology run:
>>>./geneSCF -m=normal -i=test/H0.list -o=test/output/ -t=sym -db=GO_MF -bg=20000 --plot=yes -org=goa_human
predicted results will be in 'geneSCF-master-vx.x/test/output/' folder
>>>./geneSCF -m=normal -i=test/H12.list -o=test/output/ -t=sym -db=GO_MF -bg=20000 --plot=yes -org=goa_human
predicted results will be in 'geneSCF-master-vx.x/test/output/' folder
KEGG run:
>>>./geneSCF -m=normal -i=test/H0.list -o=test/output/ -t=sym -db=KEGG -bg=20000 --plot=yes -org=hsa
predicted results will be in 'geneSCF-master-vx.x/test/output/' folder
>>>./geneSCF -m=normal -i=test/H12.list -o=test/output/ -t=sym -db=KEGG -bg=20000 --plot=yes -org=hsa
predicted results will be in 'geneSCF-master-vx.x/test/output/' folder
Study 2: Differentially expressed genes with median fold change > 2 between CLL patients and healthy individuals (RNAseq dataset).
KEGG run:
>>>./geneSCF -m=normal -i=test/TumorNormal_fc2.list -o=test/output/ -t=sym -db=KEGG -bg=20000 --plot=yes -org=hsa
NCG run:
>>>./geneSCF -m=normal -i=test/TumorNormal_fc2.list -o=test/output/ -t=sym -db=NCG -bg=20000 --plot=yes -org=Hs
predicted results will be in 'geneSCF-master-vx.x/test/output/' folder
There will be four output file for each run. A TSV file with all ranked functions with statistics and a bubble plot with three different formats (PNG, SVG and PDF).
Note: Plots required 'ggplot2' to be installed on the system. If specified --plot=yes and you cannot find the plots, means R package or 'ggplot2' is not available in your system.
Output TSV file description
| #Column | GeneSCF output | Description |
|---|---|---|
| 1 | Genes | User gene list hits |
| 2 | Process~name | Name of matching functions |
| 3 | num_of_genes | Number of hits in the functional database |
| 4 | gene_group | Total number of genes in corresponding functions |
| 5 | percentage% | Percentage of genes involved |
| 6 | P-value | Probability (Fisher's Exact test) |
| 7-12 | Multiple testing correction | False Discovery Rate values |